go.ncsu.edu/ebookpackages
About me...
I am Analytics Coordinator and Collections & Research Librarian for Social Sciences at NC State Libraries.
My work primarily involves data analysis for internal, operational decision making.
I do most of my work in Python, SAS and R.
You can find this notebook and sample data to run it on GitHub
https://github.com/jnvickery/EbookPackageAnalysis
Tools that I'm using in this example
- Python with Pandas and a little Matplotlib
- R version is on GitHub
- Jupyter Notebook
- Presentation slides created with reveal.js
About the analysis framework...
You really only need 3 data sources
- List of packages purchased with date (or year) purchased
- Publisher title lists for each package
- Yearly COUNTER usage reports
We'll use Elsevier packages purchased by NC State between 2012 and 2017 as an example.
The aim is to analyze usage at the package level to inform future decisions to update the collection.
About the data files...
1. List of packages purchased by year
- This is a homegrown file that will vary depending on your situation
- I'm using data from Serials Solutions
- It will require a link to the package title lists. In this case it's Elsevier's "Package Code"
- The important part is to determine the first year that usage would be relevant based on the purchase year
2. Title lists
- These are the lists of titles in Elsevier ebook packages
- Downloaded from: https://www.elsevier.com/solutions/sciencedirect/content/book-title-lists
- We just need these columns from each title list:
- Package name
- Package ID
- ISBN
- Book Title
- Year
3. COUNTER reports by year
- These are the regular BR2 reports
- These are saved to the same folder and named "YYYY_Elsevier.xlsx" (e.g. 2016_Elsevier.xlsx)
So...down in the weeds a bit with some python code
The first thing we need to do is import some python packages
# import the python packages that we need
import pandas as pd
import os
import matplotlib.pyplot as plt
%matplotlib inline
Then we can get the list of packages purchased from our homegrown file
# get list of elsevier ebook package codes into a dataframe
pkgcodes = pd.read_excel('H:\presentations and conferences\Charleston\Charleston 2018\presentation\packageNames.xlsx',
                         usecols='C,E',
                         converters={'PackageCode':str,'FirstUsageDate':int})

# and look at the first few rows
pkgcodes.head(3)
The next few cells get the ebook title lists from wherever you saved them
Since there are several title list files we can use a "for loop" to read each one and save them to a dataframe
# loop through the Elsevier title lists
# we're also replacing spaces in the column names with an underscore
for yr in range(2007,2018):
    fpath = os.path.join(mydir,'ebook'+str(yr)+'.xlsx')
    df = pd.read_excel(fpath, converters={'ISBN':str})
    df.columns = [c.replace(' ', '_') for c in df.columns]
    titles = titles.append(df)
Now we need to do a little clean-up of the "titles" dataframe
- keep selected columns
- subset them to only include purchased packages
- reformat ISBN to remove dashes
# just keep the columns we want
titles = titles[['Book_Title', 'ISBN', 'Package_ID', 'Package_name', 'Year']]
# subset title lists where code only in list of purchased codes
titles = titles[titles['Package_ID'].isin(pkgcodes['PackageCode'])]
# reformat ISBN to remove dashes
titles['ISBN'].replace(regex=True,inplace=True,to_replace=r'\D',value=r'')
# see how it looks
titles.head(3)
Now we'll merge the "FirstUsageDate" column from "pkgcodes" dataframe to "titles" dataframe
# add FirstUsageDate from the pkgcodes dataframe
titles = pd.merge(titles,pkgcodes, how='left', left_on='Package_ID', right_on='PackageCode')
This next section gets the Elsevier usage data
Loop through the Elsevier COUNTER usage reports and merge them to "titles" dataframe.
A few things happen in the loop...
Just use the ISBN and TOTAL columns from each COUNTER report
Save each year's usage report to a temporary dataframe
Merge that to the "titles" dataframe so we have a column for each year's usage
Get rid of dashes in the ISBN
And set usage to zero if it falls before the "FirstUsage" date.
# loop through years to get Elsevier usage
# usage must be from the year greater than or equal to the first usage year of the package
for yr in range(minyr,maxyr+1):
    year = yr
    fpath = os.path.join(mydir,str(yr)+'_Elsevier.xlsx')
    use = pd.read_excel(fpath, sheet_name='Sheet1', usecols="F,H", converters={'ISBN':str})
    use = use.rename(columns={'TOTAL':'use'+str(yr)})
    use['ISBN'].replace(regex=True,inplace=True,to_replace=r'\D',value=r'')
    use['UsageYear'] = year
    use['use'+str(yr)].fillna(0, inplace=True)
    titles = pd.merge(titles, use, how='left', on='ISBN')
    titles.loc[(titles['UsageYear'] < titles['FirstUsageDate']), 'use'+str(yr)] = 0
    titles['use'+str(yr)].fillna(0, inplace=True)
    titles.drop('UsageYear', axis=1, inplace=True)
# check out a few columns from the first rows
titles.loc[:, titles.columns.str.startswith(('Book_Title','use'))].head(3)
Sum across "USE" columns to create a "TotalUse" column for each title and save to a "TotalUse" dataframe
# sum across "USE" columns to create a "TotalUse" column for each title
# transpose then sum then transpose back
TotalUse = titles.T.groupby([s.split('use')[0] for s in titles.T.index.values]).sum().T.rename(columns={'':'TotalUse'})
TotalUse.sort_values(by='TotalUse', ascending=False, inplace=True)
TotalUse[['TotalUse','Book_Title','PackageCode']].head(3)
The next section defines and calls a function to group TotalUse into categories
- I've grouped usage into categories of 0, 1, 2-4, 5-50 and > 50
# define a function to group
def usegroup(TotalUse):
    global UseCategory
    if TotalUse > 50:
        return '> 50'
    elif 5 <= TotalUse <= 50:
        return '5-50'
    elif 2 <= TotalUse <= 4:
        return '2-4'
    elif TotalUse == 1:
        return '1'
    elif TotalUse == 0:
        return '0'
# apply the function
TotalUse['UseCategory'] = TotalUse.TotalUse.apply(usegroup)

# check a few columns from the first rows
TotalUse[['TotalUse','Book_Title','UseCategory']].head(3)
Reformat the package names so that they can be put into broad subject groups
- Clean up names so something like "eBook - Computer Science 2015" is just "Computer Science"
# strip out "eBook - " and the date from PackageName
TotalUse['Package'] = TotalUse['Package_name'].replace(regex=True,inplace=False,to_replace=([r'eBook - ',r'\d*']),value=r'')
Gets counts of UseCategory by Package
x = TotalUse.groupby('PackageCode').size().to_frame('Total').reset_index()
y = TotalUse.groupby(['Package', 'FirstUsageDate', 'PackageCode', 'UseCategory']).size().unstack(fill_value=0).reset_index()
groups = pd.merge(x,y, on='PackageCode')
groups[['Package','PackageCode','0','1','2-4','5-50','> 50']].head(3)
# add percentages
cols = ['0','1','2-4','5-50','> 50']
for c in cols:
    groups['Pct '+c] = groups[c]/groups['Total']
groups[['Package','PackageCode','Pct 0','Pct 1','Pct 2-4','Pct 5-50','Pct > 50']].round(2).head(3)
groups[['Package', 'PackageCode', 'FirstUsageDate', 'Pct 0']].sort_values(by='Pct 0', ascending=False).round(2).head(10)
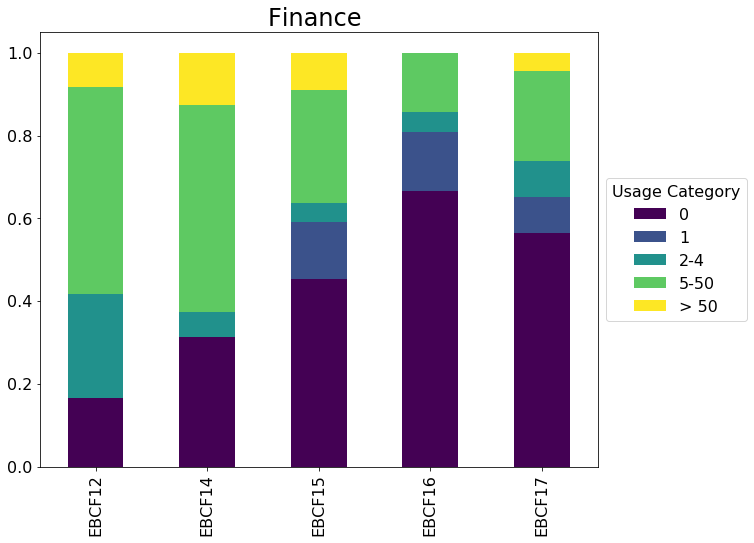
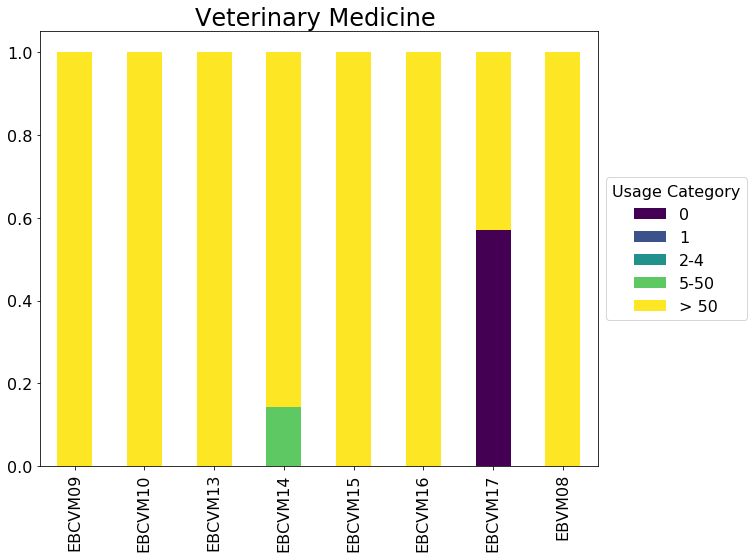
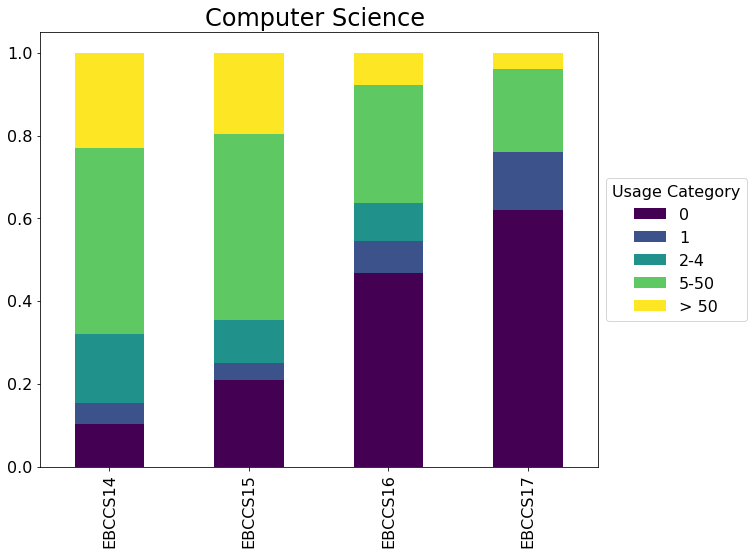
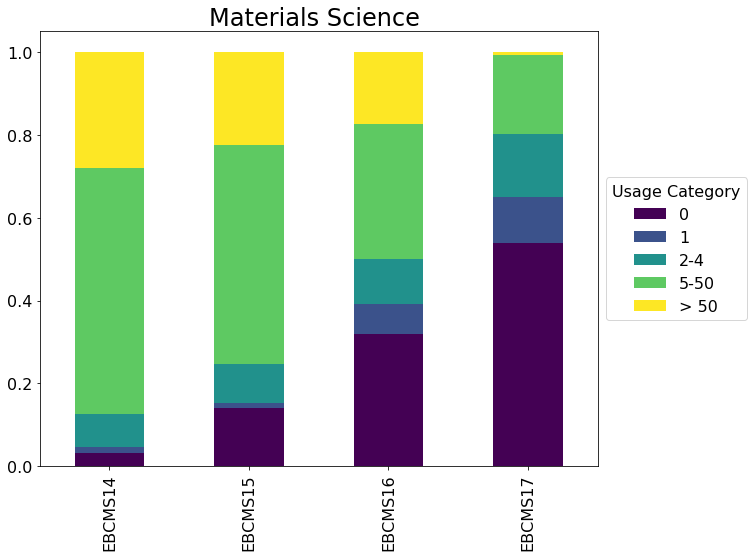
From the list above, it's clear that more recent purchases have more zero use titles
- Limit to packages with a first usage year of 2012-2014
# limit to 2012-2014
groups[['Package', 'PackageCode', 'FirstUsageDate', 'Pct 0']].loc[groups['FirstUsageDate'].isin([2012,2013,2014])].sort_values(by='Pct 0', ascending=False).round(2).head(5)
# subset for just the columns we need
cols = ['Package', 'PackageCode', 'Pct 0', 'Pct 1', 'Pct 2-4', 'Pct 5-50', 'Pct > 50']
charts = groups.filter(cols).set_index(['PackageCode'])
# rename the "Pct" columns
charts.columns = [c.replace('Pct ', '') for c in charts.columns]
# hide a "max open warning" since we'll be looping over quite a few packages
plt.rcParams.update({'figure.max_open_warning': 0})

# Loop over each Package and create a stacked bar chart
for title, pkg in charts.groupby(['Package']):
    ax = pkg.plot(kind='bar', title=title, stacked=True, rot=90, colormap='viridis', figsize=(10,8), fontsize=16)
    ax.set_title(title, fontsize=24)
    ax.set_xlabel('')
    leg = ax.legend(loc='center left', bbox_to_anchor=(1, 0.5), fontsize=16)
    leg.set_title('Usage Category',prop={'size':16})